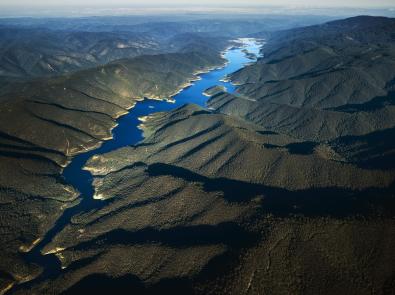
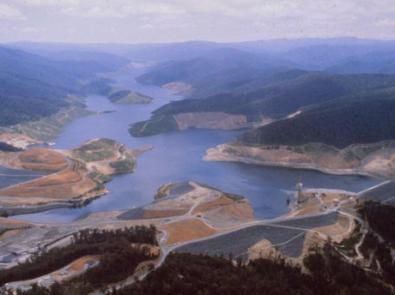
Thomson is Melbourne’s largest reservoir, making up about 60% of Melbourne’s total water storage capacity. It was designed to build up our water reserves in wet years, for use when conditions are dry.
Thomson Reservoir is filled by rainfall received by the surrounding catchment. It can transfer over one billion litres of water per day to Upper Yarra Reservoir, which in turn supplies Silvan Reservoir. From Silvan, water can be distributed throughout metropolitan Melbourne.
Key facts
The dam at Thomson Reservoir is an earth and rockfill embankment, completed in 1984.
- Catchment area: 48,700 hectares
- Surface area: 2,230 hectares
- Total capacity: 1,068,000 megalitres
- Dam height: 165 metres
- Dam length: 590 metres (main bank only, saddle dam is an extra 580 metres)
Thomson is the third-largest reservoir to supply a major Australian city, behind Warrangamba Dam (New South Wales) and Wivenhoe Dam (Queensland). It is large enough to contain all of the dams servicing Canberra, Adelaide and Perth!
Put another way, it can store almost four times as much as Melbourne’s next largest reservoir, Cardinia Reservoir, or enough water to fill:
- 2 Sydney Harbours
- 628 MCGs
- 427,200 Olympic swimming pools.
As well as servicing Melbourne in times of drought, Thomson Reservoir also provides water to maintain healthy flows in the Thomson River, support agriculture in the Macalister Irrigation District downstream, and generate hydroelectricity.
Water catchment protection and access
Thomson Reservoir is an on-stream reservoir, filled by rivers or rainfall that runs off the nearby forested water catchments. There is:
- no entry to the inner catchment, with offenders subject to prosecution under the Water Act 1989 (Vic)
- entry permitted to the outer catchment, with restrictions determined by the Forest (Recreation) Regulations
- entry permitted to publicly accessible roads and commercial timber harvesting, vehicle-based day visitors, multiple walking tracks and foot-based camping (with restrictions) on the Australian Alps Walking Track.
Melbourne Water continually reviews our protected catchments to determine if more areas can be opened to the public. While this would allow more people to enjoy Victoria’s vast natural spaces, it must be balanced with protecting our precious drinking water for the safety of our community.
Impact on storage capacity
Thomson Reservoir was designed to serve a city of 5 million people, based on rainfall and water use at the time it was proposed in 1968.
On 31 July 1984, the newly-built and virtually empty reservoir was officially factored into Melbourne’s water storages. This more than doubled Melbourne’s total storage capacity, and dragged down storage levels from 65% to 26% overnight.
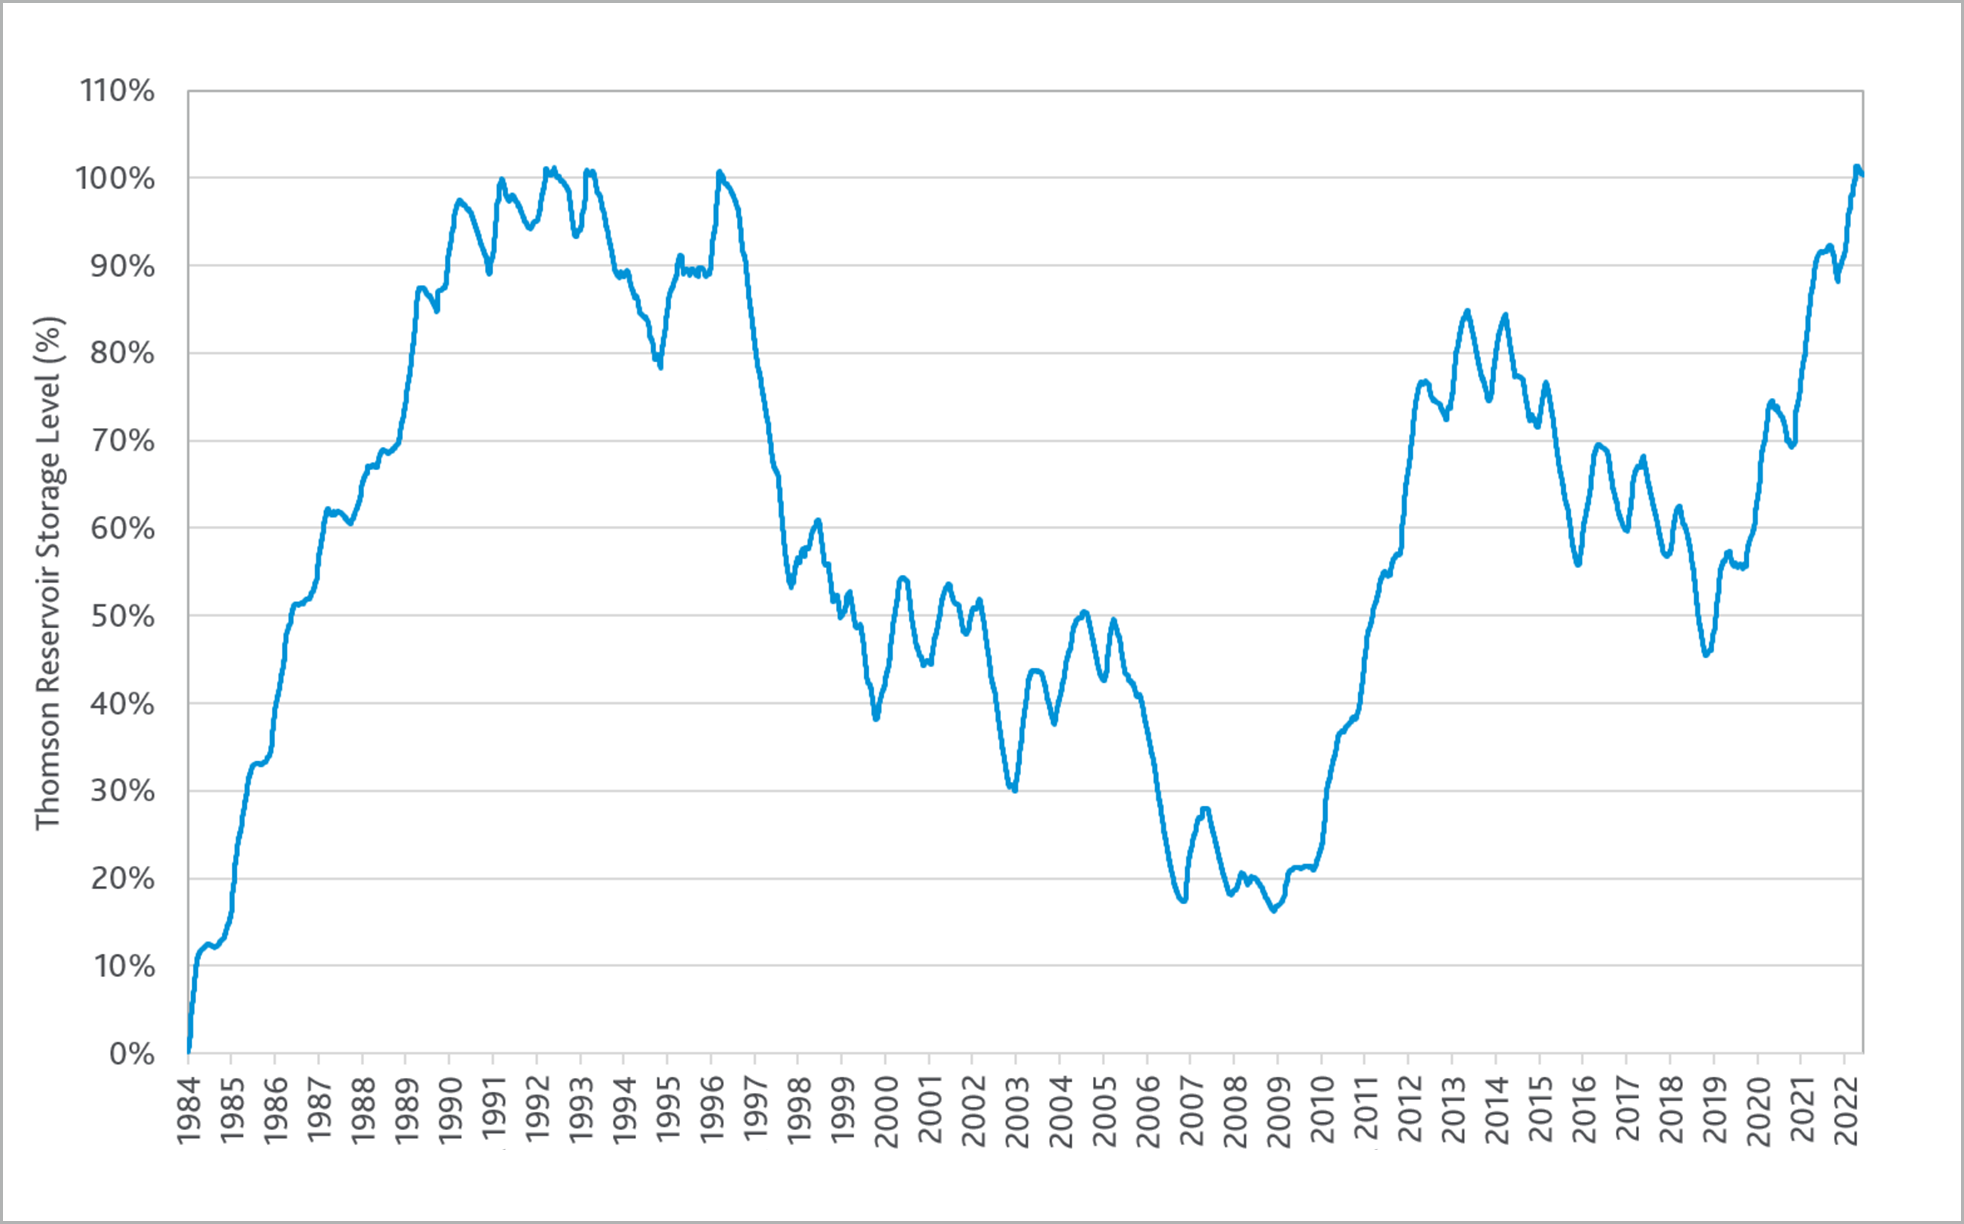
It has been full four times: 1992, 1993, 1996 and 2022.
Live rainfall and water storage data
Get the latest information on each of our 10 major reservoirs, including daily water storage levels and hourly rainfall data.
Rainfall and storage levels over the years
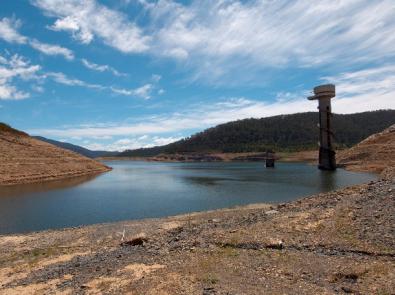
During the 1997-2009 Millennium Drought, record low inflows severely tested the commonly-held notion that Thomson would ‘drought proof’ Melbourne. Its storage levels dropped from full to just 16% of capacity in mid-2009.
In 2010 and 2011, Australia’s wettest two-year period on record, exceptionally high rainfall helped Thomson Reservoir recover. It was kept from supplying Melbourne while other parts of the water supply network provided water instead, allowing it to ‘rest and refill’.
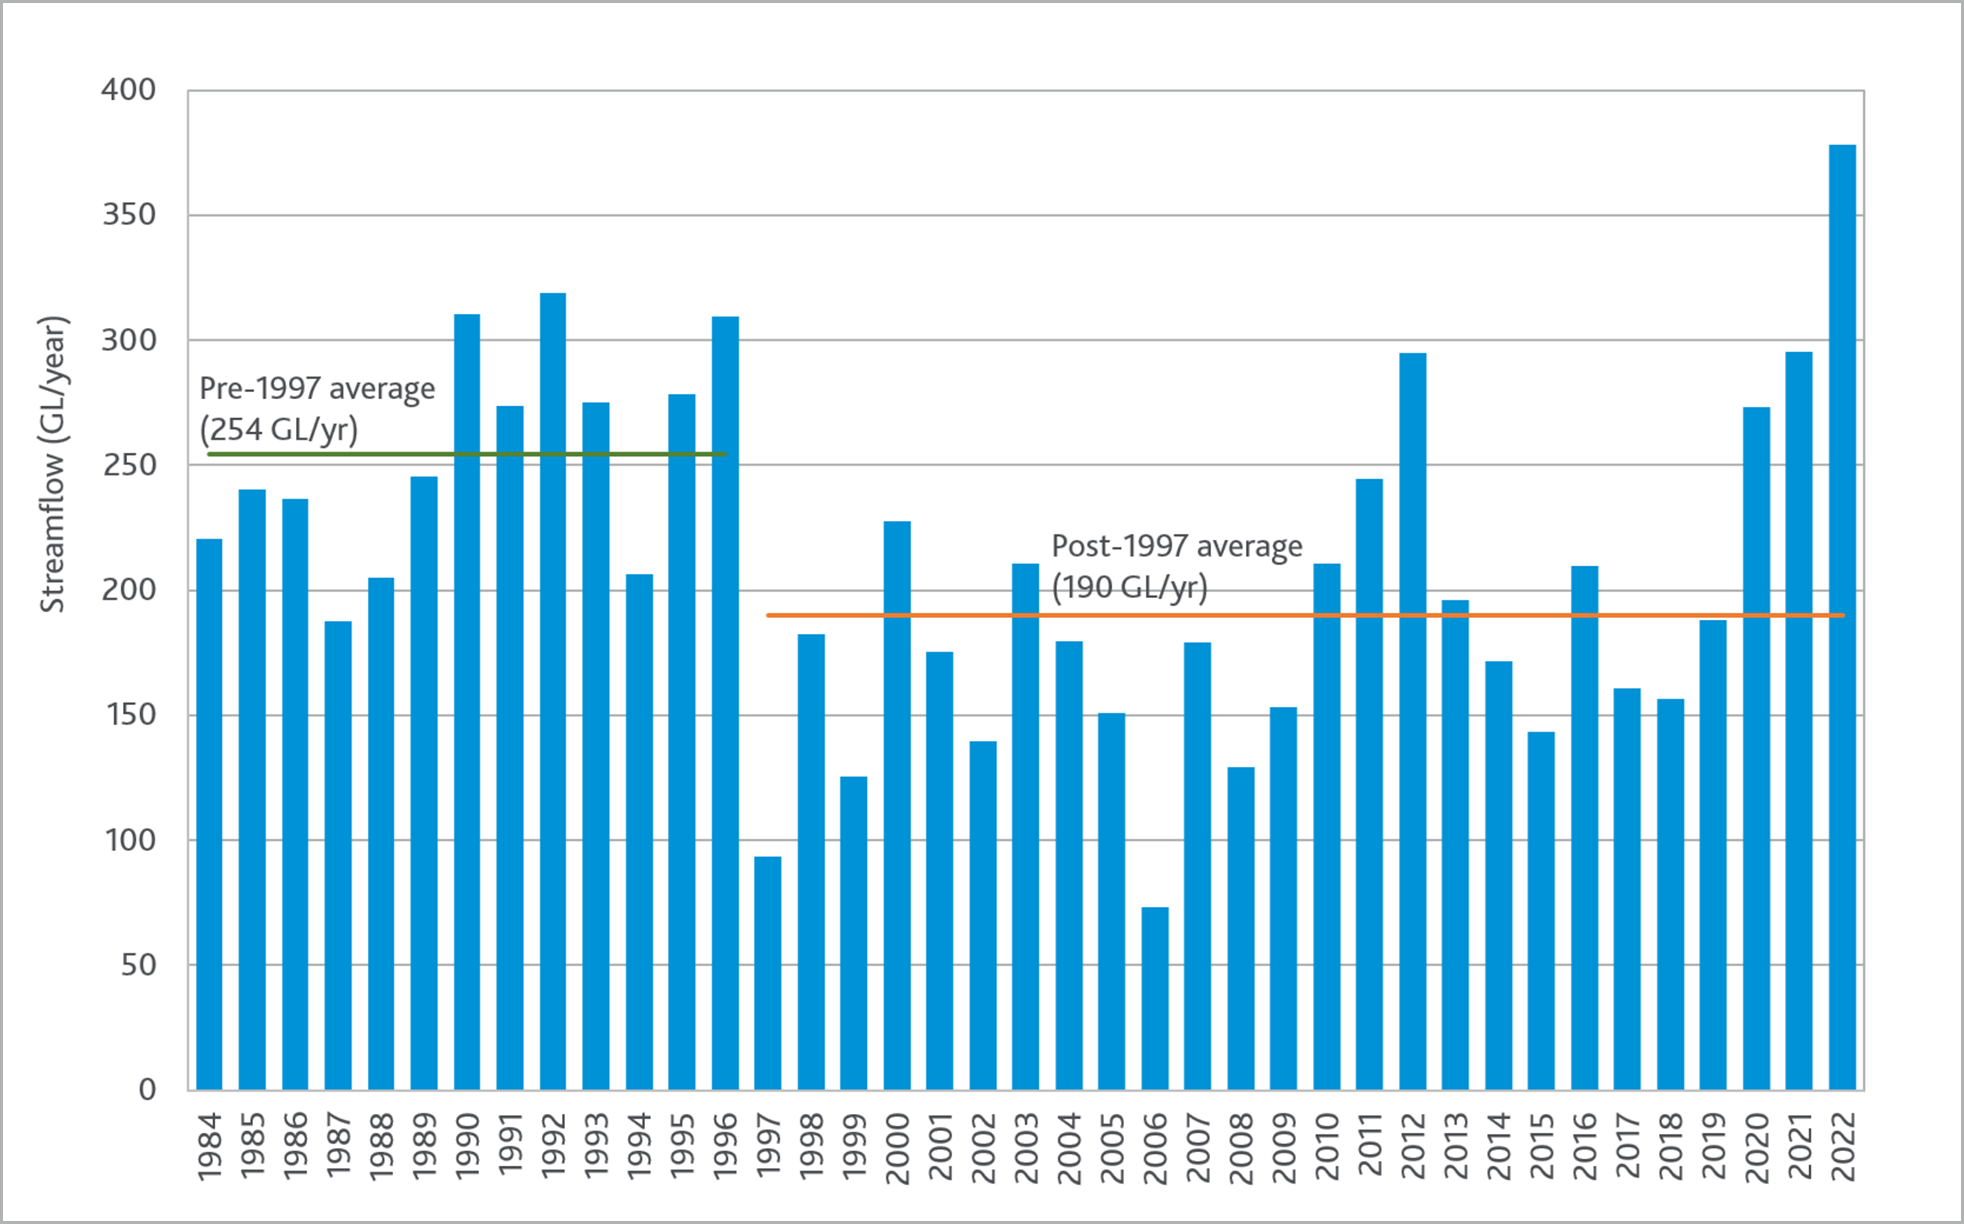
The following graphs show Thomson’s water inflows and storage levels since 1984.
- Inflow into Thomson Reservoir (1984-2022)
-
The light blue bars show how much water has flowed into Thomson each year since 1984. The green and orange lines show how the average has changed in the past 37 years: from a yearly average of 254 billion litres, to below-average inflows of 182 billion litres since 1997. It’s a similar story with Melbourne’s nine other reservoirs.
- Storage levels at Thomson Reservoir (1984-2022)
-
The blue line shows changes in the volume of water in Thomson between 1984 and 2022. It has been full four times: 1992, 1993, 1996 and 2022.
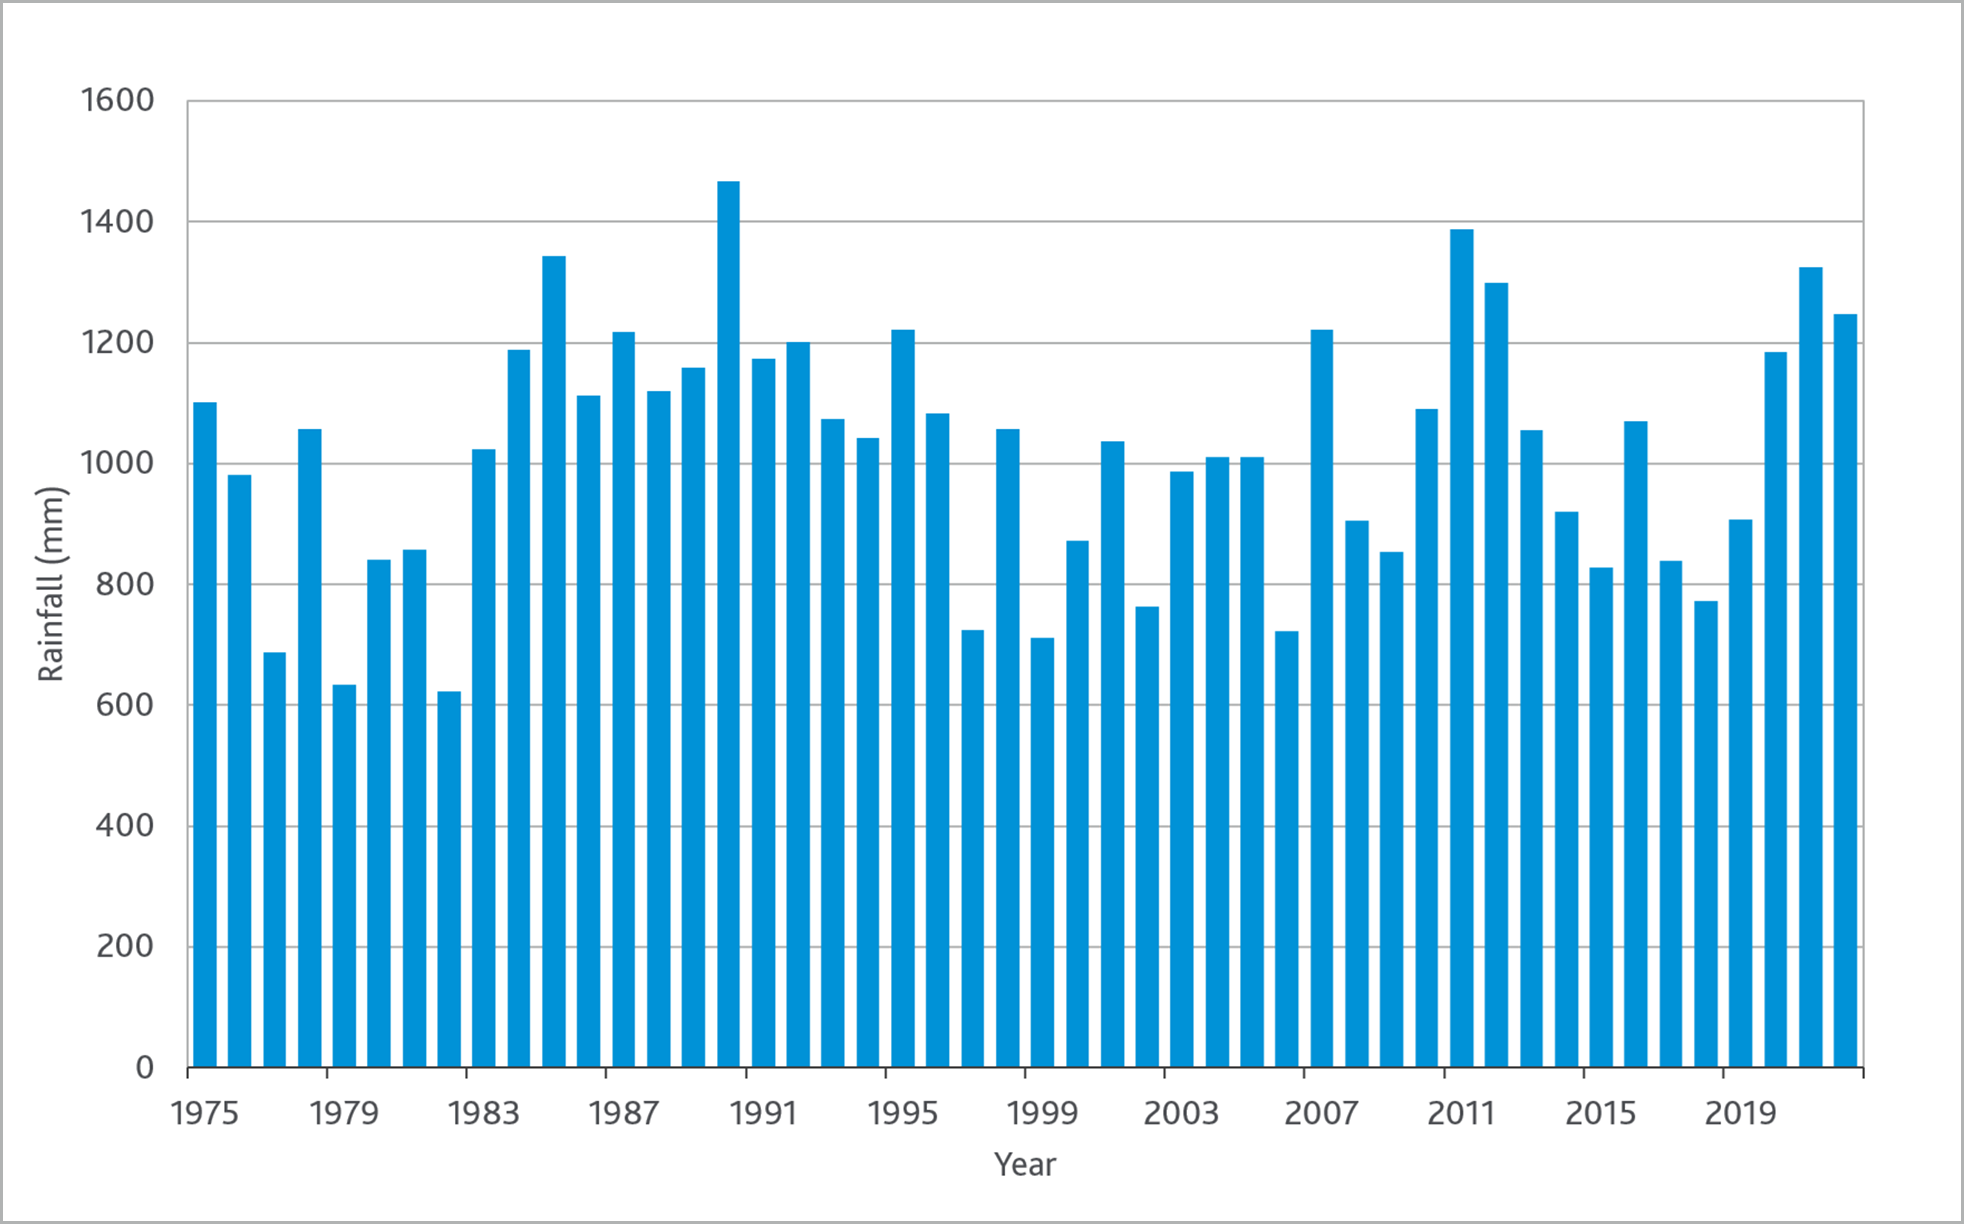
- Annual rainfall at Thomson Reservoir (1975-2022)
Monthly rainfall records (mm)
Last updated: January 2023
| Month | Wettest | Driest | Average |
|---|---|---|---|
| January | 160.8 (2016) | 8.0 (2013) | 62.2 |
| February | 216.8 (1994) | 3.0 (1976) | 51.1 |
| March | 170.6 (2012) | 10.2 (2004) | 68.1 |
| April | 337.8 (1990) | 17.9 (1981) | 74.8 |
| May | 179.8 (2000) | 18.4 (2009) | 72.1 |
| June | 325.0 (2007) | 7.9 (1979) | 105.8 |
| July | 198.6 (1987) | 20.8 (1976) | 100.3 |
| August | 227.6 (1990) | 13.4 (1982) | 105.6 |
| September | 236.6 (1993) | 36.6 (2015) | 104.5 |
| October | 296.5 (1976) | 16.0 (2015) | 98.2 |
| November | 200.0 (2007) | 32.0 (1979) | 98.0 |
| December | 178.6 (1986) | 19.4 (2019) | 80.4 |
| Annual total | 1467.2 (1990) | 623.5 (1982) | 1021.0 |
Historical construction footage
Thomson Reservoir was built by more than a thousand construction workers. They were housed with their families at the purpose-built town of Rawson nearby, which remains to this day.
See photos of the dam’s construction, as well as storage levels over the decades, in our Thomson Dam album on Flickr.
Or get a glimpse of work in progress with these excerpts from our historical video collection:
You may also like...
History of our water supply system
Access to clean water has shaped human settlements throughout history, and Melbourne is no different.
Our water supply system
Melbourne has some of the highest-quality drinking water in the world. Learn how it makes its long journey to your tap.

