We monitor our water storages so that all water users, like environment agencies and other water authorities, can access the water they need. Learn what data is available and why we report it in a particular way.
View the latest data
Daily water storage levels (as recorded at 8am) are updated at about 2-3 pm on weekdays, and 4-5 pm on weekends and public holidays.
Available data
We publish both daily and weekly data on Melbourne’s water supply system as a whole, as well as for individual storage areas. This includes:
- Water storage levels: readings taken at 8am on a specific date.
- Catchment rainfall: total rainfall recorded over the past 24 hours to 8am (daily data), or the 7 days to Thursday 8am (weekly data).
- Flow into water storages: total inflows from rivers, streams and rain, recorded over the past 24 hours to 8am (daily data) or the 7 days to Thursday 8am (weekly data).
- Melbourne’s daily water use: includes households, business and some non-metropolitan areas, presented as a total (daily data), or as litres per person (calculated each week).
All water storage data is reported by volume: as gigalitres (GL, billion litres) or megalitres (ML, million litres). Rainfall is measured by depth (millimetres).
Verification
Data is manually checked against readings taken in person. As a result we sometimes adjust our figures (usually within the same week), so there can be discrepancies.
Verified rainfall and inflow data is only provided for the four major storages that contribute the most to Melbourne’s total water storage levels. Rainfall elsewhere usually has little impact, but hourly unverified data is available via our rainfall and river levels web app.
Select and compare data
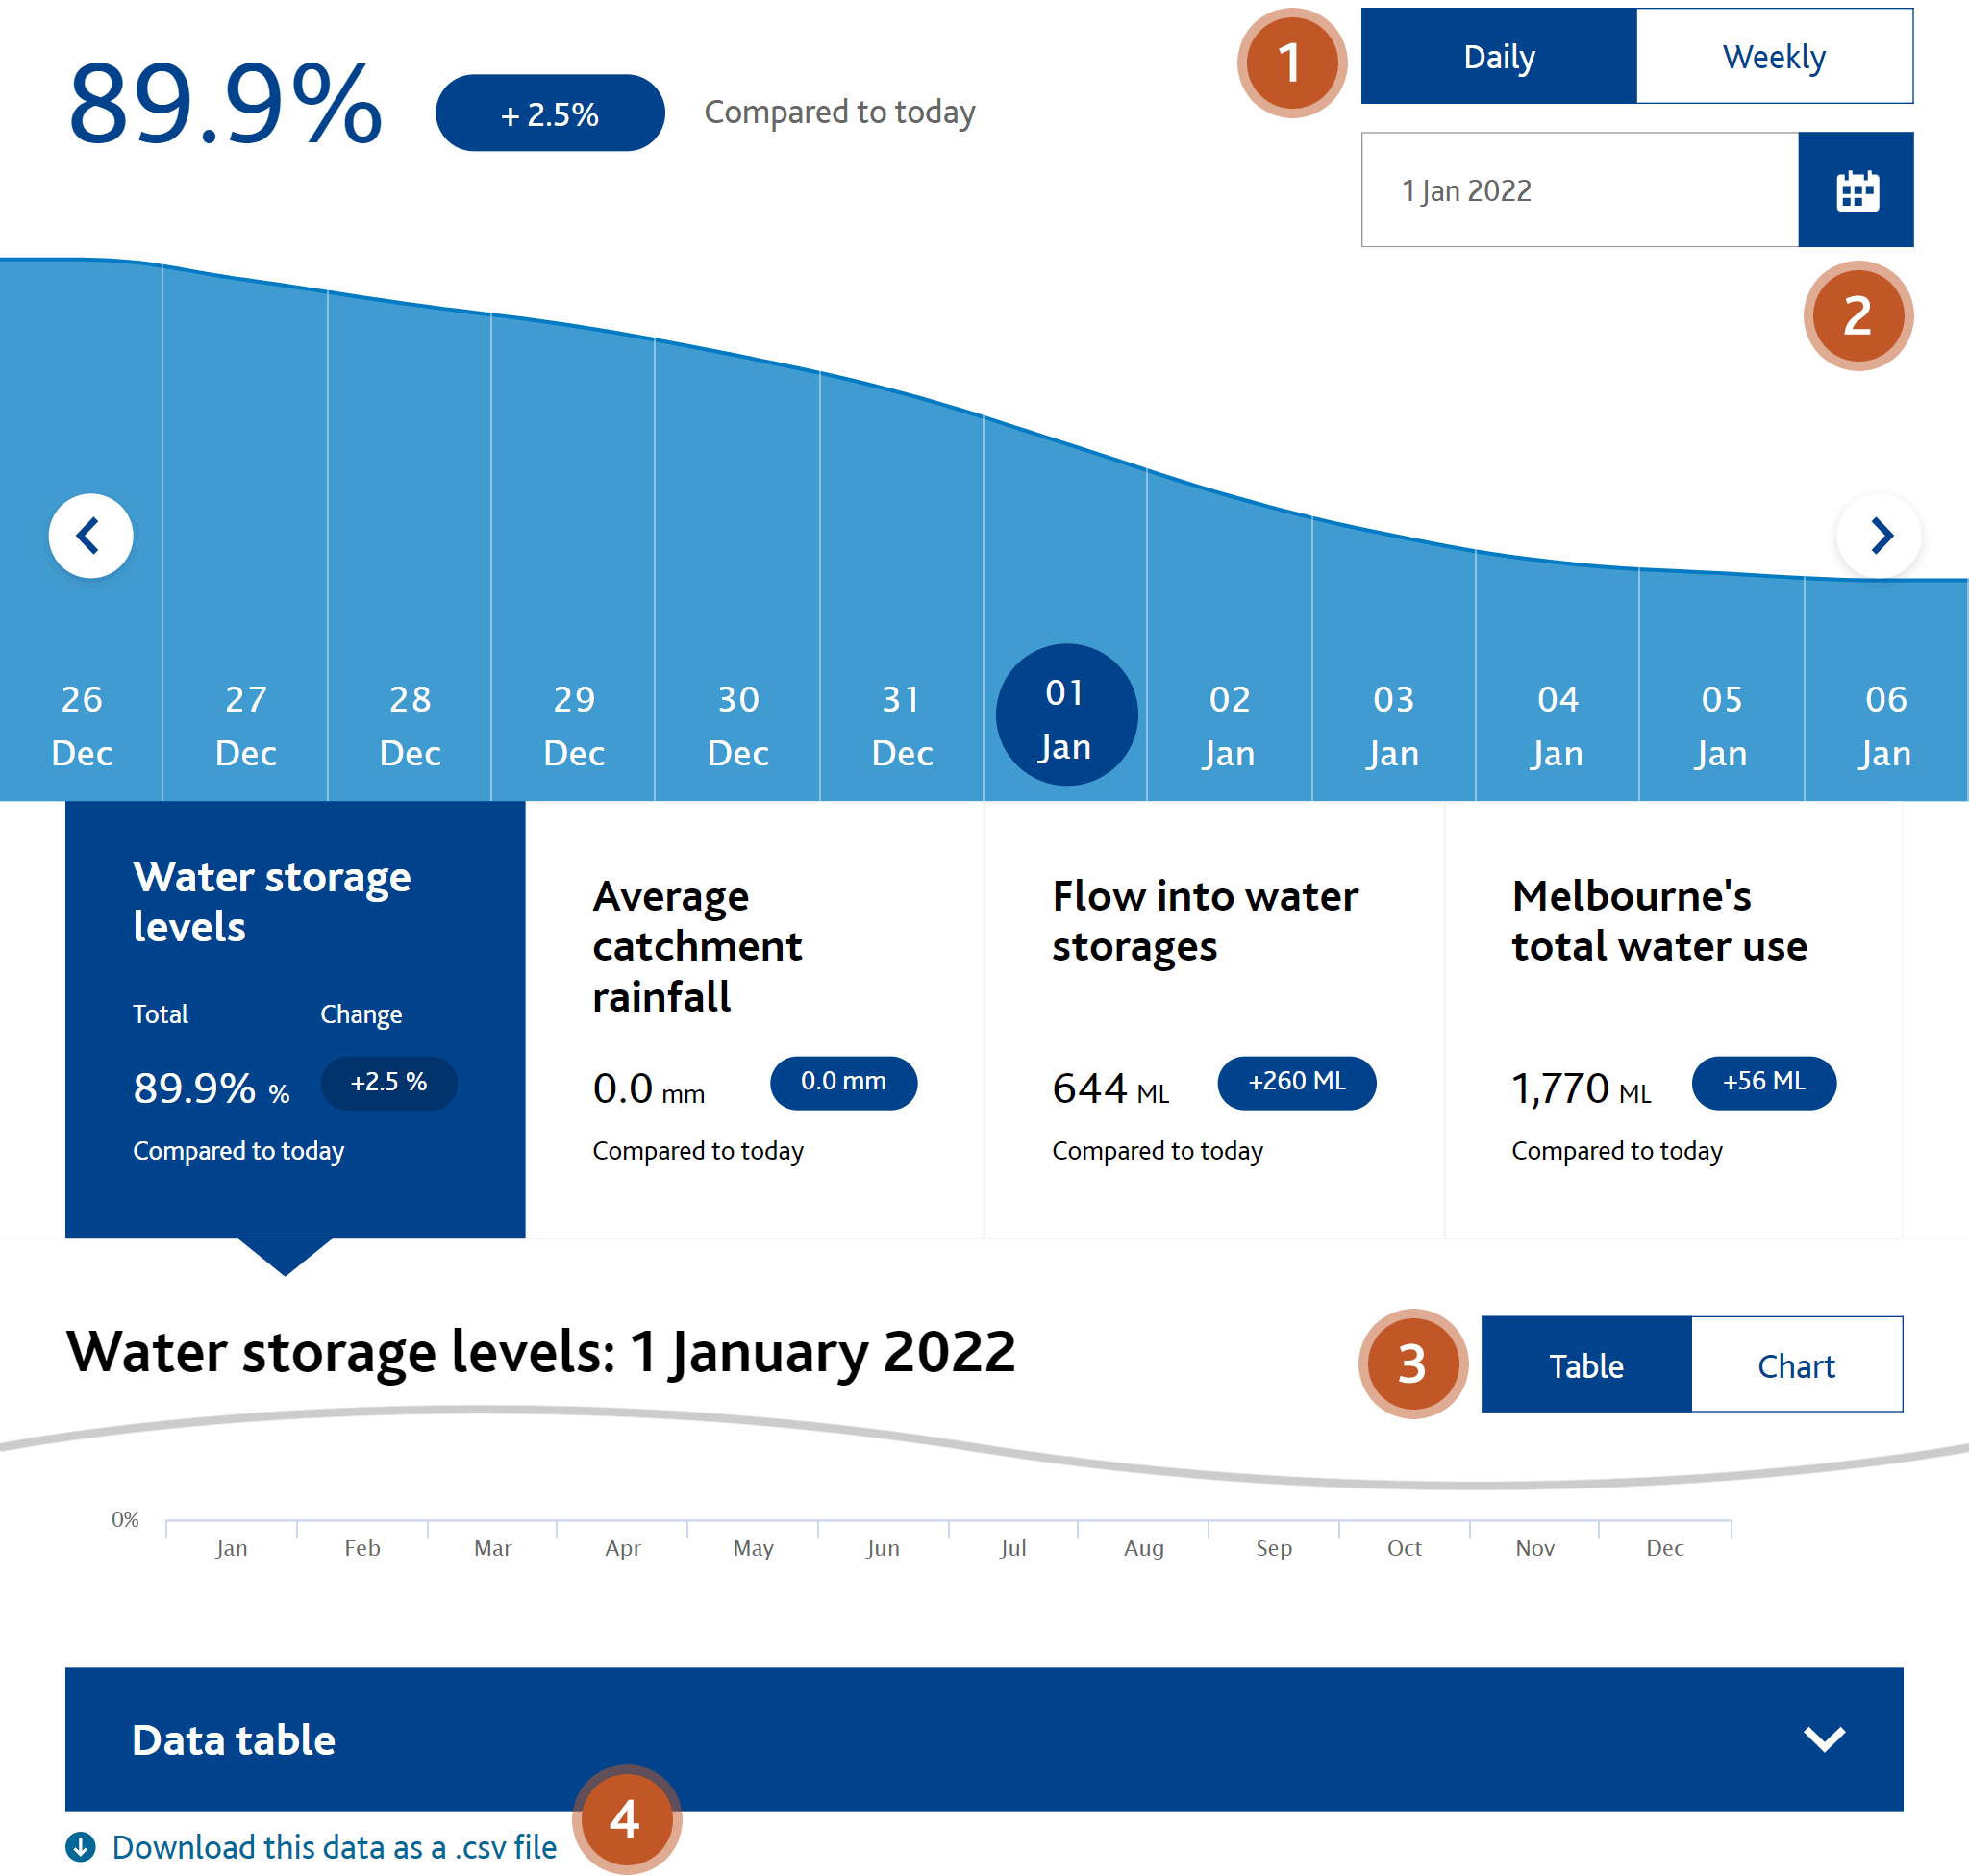
Our water storage levels web app displays a range of data in different formats. Here’s how to get the most out of it.
- 1. Daily and weekly data
-
Toggle between viewing daily and weekly data.
When viewing weekly data, a weekly water report is displayed under the main storages graph. This compares data to the previous week, the 30-year average and at the same time the previous year.
- 2. Select and compare dates
-
Show data for a specific date by selecting it from the calendar.
The summary data in the 4 tabs below the graph will automatically update with comparisons to the latest data, i.e. today or yesterday (daily view) or the previous week (weekly view).
- 3. Table and chart views
-
Switch between table and chart (graph) views for each available dataset.
Note: for historical water storage levels and inflow over the years, table data can be viewed by expanding the accordion under the chart.
- 4. Data downloads
-
Raw data can be downloaded in .csv format by following the link under each table or graph.
Understanding water storage levels
Melbourne’s total storage levels are expressed as percentage of the combined capacity of our 10 major reservoirs. This is more accurate than looking at individual reservoirs because of their vast differences in storage capacity: for example, the amount of water needed to completely fill O’Shannassy Reservoir would only fill 0.3% of Thomson Reservoir.
Daily volume data
Changes to storage figures are calculated by subtracting all reservoirs’ incoming flows from total water use. This includes water consumption, releases to the environment and water held for Southern Rural Water.
Storage levels occasionally go over 100%, meaning the reservoir is holding more than its set operating capacity (the figure we report against). This is similar to drink bottles exceeding their labelled capacity when they are filled to the brim.
Historical data
Historical storage levels show the changes in Melbourne’s total water storage capacity as reservoirs were built, upgraded, brought under Melbourne Water’s responsibility or disconnected from the water supply system. This has dramatically impacted reported storage levels, which are reported as a percentage of total system capacity.
The following table outlines the major changes to Melbourne’s total water storage capacity.
|
Date |
Change |
Total capacity (ML) |
|---|---|---|
|
16 Sep 1957 |
Upper Yarra Reservoir comes online |
296,230 |
|
13 Aug 1971 |
Greenvale Reservoir comes online |
323,230 |
|
7 Sep 1973 |
Cardinia Reservoir comes online |
610,230 |
|
19 Jul 1980 |
Sugarloaf Reservoir comes online |
706,230 |
|
31 Jul 1984 |
Thomson Reservoir comes online |
1,774,230 |
|
1 Jan 1986 |
O’Shannassy Reservoir’s total volume decreases |
1,773,000 |
|
10 Sep 1991 |
Tarago and Devilbend reservoirs included after water authorities merge |
1,825,000 |
|
1 Jan 1999 |
Tarago Reservoir taken offline |
1,787,500 |
|
1 Jun 2002 |
Devilbend Reservoir decommissioned |
1,773,000 |
|
24 Jun 2009 |
Tarago Reservoir reconnected after major upgrade |
1,810,500 |
|
1 Jul 2010 |
Water reporting aligned with Bureau of Meteorology (most reservoirs previously reported to the nearest 1,000 ML) |
1,812,175 |
|
1 Jan 2012 |
Sugarloaf Pipeline allocation removed (water held in Lake Eildon on Melbourne's behalf) |
1,812,175 |


